Transmission Line Behavior with Bounce Diagrams
Introduction
In the radio frequency (RF) engineering, the study of transmission lines stands as a fundamental pillar. These lines, vital for carrying signals over distances, exhibit intriguing responses to various input signals like unit steps and pulses. Understanding these responses is pivotal for optimizing signal integrity and transmission efficiency, and one indispensable tool for this analysis is the bounce diagram.

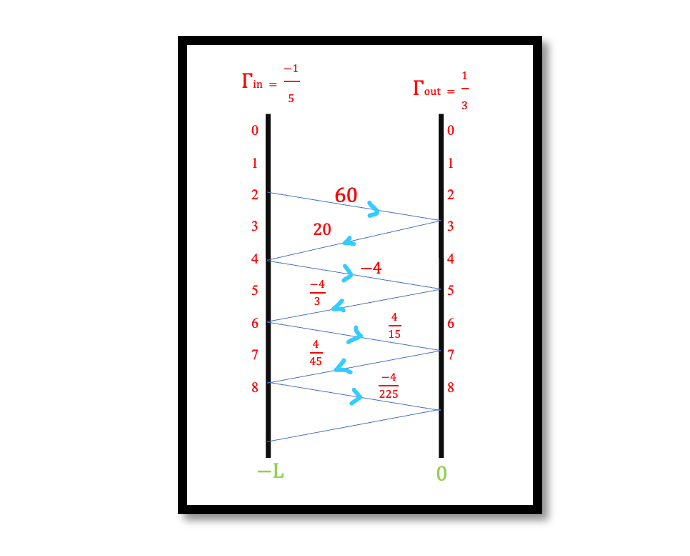
At its core, a bounce diagram provides a visual representation of how voltage or current propagates along transmission lines concerning both time and distance. It’s a graphical depiction where the horizontal axis denotes distance, while the vertical axis signifies time. One of the remarkable aspects of a bounce diagram lies in its ability to illustrate the leading and trailing edges of voltage or current waveforms. Imagine a series of diagonal lines adorning the diagram—these lines signify the transitions or edges of the waveform. Each of these lines is meticulously labeled with the corresponding voltage or current amplitude for a specific point along the transmission lines.
This spatial-temporal representation offers a holistic view of how signals evolve and travel through the transmission lines. It’s not merely a static illustration; rather, it captures the dynamic behavior of signals, showcasing their changes over time and distance.
For engineers delving into the optimization of transmission line behavior, bounce diagrams are indispensable. They allow for the meticulous analysis of unit step and pulse voltage responses, aiding in understanding how signals propagate, reflect, and interact within these lines. By studying these diagrams, engineers can fine-tune transmission line parameters, optimize impedance matching, and minimize signal distortions or losses.
In essence, bounce diagrams serve as a bridge between theoretical understanding and practical application in RF engineering. They empower engineers to not only comprehend but also manipulate and optimize signal behavior within transmission lines, paving the way for more efficient and reliable communication systems. In the realm of RF engineering, where precision and optimization reign supreme, the bounce diagram stands tall as a crucial tool, unraveling the mysteries of transmission line behavior and paving the way for enhanced signal transmission and communication systems.
How are Bounce Diagrams useful?
Bounce diagrams serve as invaluable tools in the analysis and optimization of transmission lines in several ways:
Understanding Signal Propagation:
Visualizing Signal Behavior: Bounce diagrams provide a graphical representation of how voltage or current waves propagate through transmission lines concerning both distance and time. Engineers can easily observe how signals evolve, reflect, and interact along the line.
Identifying Signal Distortions: By mapping the path of the signal on the transmission line, engineers can pinpoint areas where reflections, distortions, or signal degradation occur. This insight is crucial for optimizing signal integrity.
Optimization and Design:
Impedance Matching: Engineers can use bounce diagrams to optimize impedance matching along the transmission line. Minimizing impedance mismatches helps reduce signal reflections, ensuring efficient signal transmission. Signal Loss Mitigation: By studying bounce diagrams, engineers can identify areas where signal loss occurs and take measures to mitigate these losses. This includes adjusting line parameters or employing signal conditioning techniques.
Transmission Line Performance Enhancement:
Fine-tuning Line Parameters: Bounce diagrams enable engineers to fine-tune transmission line parameters, such as line length, characteristic impedance, or termination, to achieve desired signal characteristics and minimize signal distortions. Optimizing for Specific Applications: Whether it’s for high-speed data transmission, power distribution, or RF systems, bounce diagrams aid in tailoring transmission lines to meet specific application requirements.
Example:
Let’s consider an example where a transmission line has a characteristic impedance (Z0) of 50 ohms and a load impedance (ZL) of 75 ohms. We’ll calculate the reflection coefficients (Γin and Γout) and provide the corresponding bounce diagram.
Given:
- Characteristic Impedance (Z0) = 50 ohms
- Load Impedance (ZL) = 75 ohms
Calculation of Reflection Coefficients:

Bounce Diagram Representation: The bounce diagram will depict these reflection coefficients at the input and output ends of the transmission line.

The calculated reflection coefficients indicate that at the input end, 1/5th of the incident wave gets reflected due to the impedance mismatch, and at the output end, the same proportion of the incident wave gets reflected with a phase change due to the negative sign. This information can be represented in a bounce diagram, where the x-axis represents distance along the transmission line, and the y-axis represents the amplitude of the reflected voltage at the input and output ends, showcasing the reflection coefficients at those points.

Learn more about more topic like this. Browse various RF course on our website and watch the course videos for more detailed understanding https://rahsoft.com/courses/. Rahsoft also provides a certificate on Radio Frequency. All the courses offer step by step approach.


