What is SNR and Noise Figure (NF)?
What is SNR?
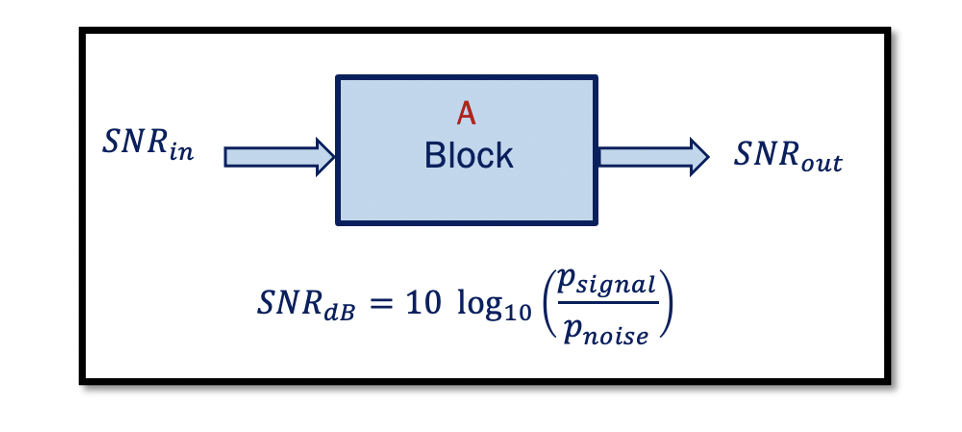
SNR is the Signal to Noise Ratio. Signal to noise ratio compares the level of the desired signal to the level of background noise. It can be shown as the ratio between the power of the signal and the power of noise. The aim is always to have higher SNR in a system; in other words, if it decreases, the noise in our system has less power, and our SNR will be higher. We can show SNR with dB in the log domain as well:
Why is SNRout less than SNRin?
Signal and noise both are amplified by amplifier so, if amplifier has no noise then SNRin=SNRout. However, since amplifier has components that produces noise, the output noise will be the amplified input noise plus the amplifier noise itself. Therefore, SNRout<SNRin.
Once the noise has contaminated the signal, it is not possible to improve the SNR. But noise might be eliminated from surrounding the signal; however, it is difficult to remove the noise in the same frequency range of the desired signal. For that reason, SNR at the output of a signal chain will never be better than the SNR at the input.
When the signal is amplified, the noise present in the signal is also amplified. Hence, SNR remains the same. The best that can be done during signal processing is to make every effort to minimize adding additional noise during the design phase. All components, active and passive, generate some level of internally generated noise. For this reason, the lowest noise components are used on the input stage before any other processing is performed.
SNR can never improve from input to output. SNR generally degrades as it passes through the signal chain.
What is a Noise Figure?
Two figures of merit are used to quantify the extent to which a component adds noise to the signal and degrades the SNR. Noise Figure (NF) and Noise Factor (F).
Noise Factor (F) is the ratio between SNRin to SNRout, and as we know that SNRout is always small; therefore, F is always higher than 1.

To quantify how noisy the circuit is, we define Noise Figure (NF). It is the logarithmic measure used to understand how noisy the given circuit is and how SNR degrades when it gets through the block.
It provides the quantified indication of how much component will degrade the SNR as a signal passes through it. Noise Figure can be expressed in dB.
How SNR affects the circuit?
As we know, SNR degrades as the signal travels through a given circuit; let’s analyse this SNR in our system so we can have an amplifier block as shown below:

This amplifier has a power gain of ‘A’ instead of voltage gain. This diagram shows SNR at the input and output of the block. At input, the SNR is equal to the power of the signal to the power of noise, and at the output, it is the output power of the signal to the output power of noise.
When the system is noiseless, SNR at the output will have the power and noise amplified with the same ratio. Noiseless system the SNRout will be equal to SNRin:

In reality, a noiseless system is not possible. Previously as we discussed that every passive or active component has a noise of its own. They generate noise, and this noise will appear at the output as Pout Noise. PNB is the noise of the block; because of this extra noise, the overall SNR will decrease. So increasing the power of noise will have less SNR. The conclusion is that always SNRout is less than SNRin for any given circuit because of the noise contribution of the block.

Learn more about this topic by taking the complete course ‘’RF Design Theory and Principles – RAHRF201’’.
Watch the course videos for more detailed understanding. Also checkout other courses on RF system and IC design on https://rahsoft.com/courses/
Rahsoft also provides a certificate on Radio Frequency. All the courses offer step by step approach.
Tag:Noise Figure, SNR


