Smith Chart Concepts in Microwave Amplifier and LNA Design
The Smith Chart plays a crucial role in the design and analysis of Microwave Amplifiers and Low-Noise Amplifiers (LNAs) by providing valuable insights into impedance matching, stability analysis, and overall performance optimization. Here’s how Smith Chart concepts are utilized in these areas:
- Impedance Matching: Microwave amplifiers and LNAs often require precise impedance matching to maximize power transfer and minimize signal reflections. The Smith Chart helps engineers visualize complex impedance transformations and design matching networks to achieve optimal impedance matching between the source, amplifier, and load.
- Stability Analysis: Stability is a critical aspect of amplifier design to prevent oscillations and ensure reliable operation. The Smith Chart aids in stability analysis by allowing engineers to examine the stability circles, which represent the regions of unconditional stability for a given amplifier configuration. By analyzing stability circles on the Smith Chart, designers can optimize component values and circuit topologies to enhance stability margins.
- Gain and Noise Figure Optimization: The Smith Chart facilitates the optimization of gain and noise figure in microwave amplifiers and LNAs. Engineers can use the chart to visualize the trade-offs between gain, stability, and noise figure, enabling the selection of optimal operating points and component values to achieve desired performance metrics.
- Transmission Line Effects: Microwave amplifiers often utilize transmission lines for impedance matching and signal routing. The Smith Chart helps in analyzing transmission line effects, such as impedance transformations, phase shifts, and reflection coefficients, allowing designers to accurately model and compensate for these effects in amplifier design.
- Load Pull Analysis: Load pull analysis is commonly used in microwave amplifier design to optimize amplifier performance under varying load conditions. The Smith Chart aids in load pull analysis by visualizing the impedance locus of the load impedance seen by the amplifier. Designers can use load pull techniques to identify optimal load impedance values for maximum power transfer and efficiency.
In summary, the Smith Chart concept is indispensable in Microwave Amplifier and LNA design, providing engineers with a powerful graphical tool for impedance matching, stability analysis, gain optimization, and overall performance enhancement. By leveraging Smith Chart principles, designers can efficiently design and optimize microwave amplifiers and LNAs for a wide range of applications in wireless communication systems, radar systems, and microwave instrumentation.
Understanding the Smith Chart
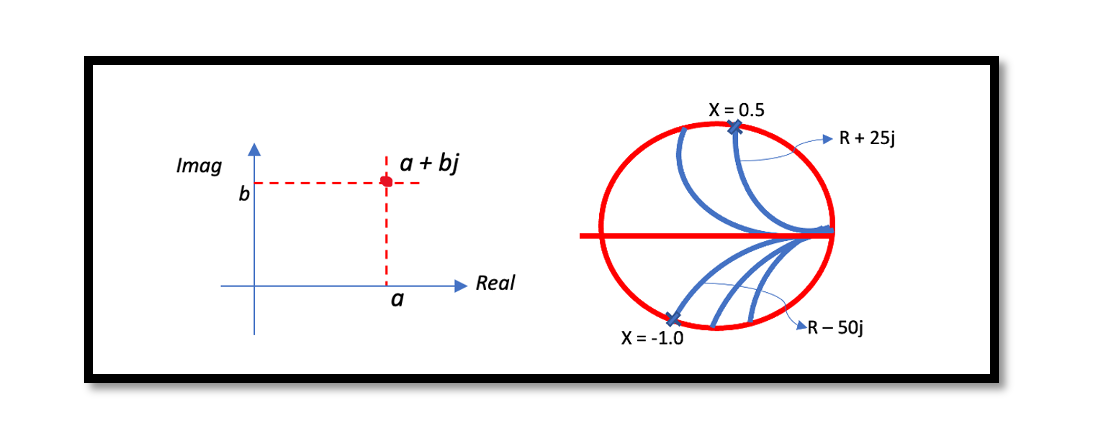
The Smith Chart is a fundamental tool in radio frequency (RF) engineering, serving as a graphical aid for analyzing and solving transmission line and matching circuit problems. It provides a visual representation of impedance values, both real and imaginary, encompassed within a single circle. This unique graphical representation facilitates efficient analysis and design of RF circuits, making it an indispensable asset for RF engineers and enthusiasts alike.
For more details on Smith Chart and how to plot on smith chart refer to this blog: Introduction to Smith Charts
Utilizing the Smith Chart in RF Engineering
The Smith Chart serves a multitude of purposes in RF engineering, streamlining various aspects of impedance analysis and circuit design. Here’s how it’s commonly utilized:
- Impedance Matching: Primarily, the Smith Chart is employed for impedance matching in transmission lines, ensuring optimal power transfer between source and load.
- Designing Matching Circuits: Engineers use the Smith Chart to design matching circuits that efficiently match the impedance of the load to the transmission line and source.
- Determining Transmission Line Length: By utilizing the Smith Chart, engineers can accurately determine the required length of transmission lines for achieving desired impedance transformations.
- Calculating Component Values: The Smith Chart aids in finding the values of inductors (L) or capacitors (C) needed for impedance matching circuits.
- Analyzing Reflection Coefficients: Engineers can easily find the reflection coefficient at both load and source ends of the transmission line using the Smith Chart.
- Identifying Transmission Line Types: It helps in identifying the type of transmission line needed for matching purposes, such as open or short-circuited lines.
- Impedance to Admittance Conversion: The Smith Chart facilitates the conversion of impedance (Z) to admittance (Y), simplifying circuit analysis.
- Locating Vmax and Vmin: Engineers utilize the Smith Chart to locate positions of maximum and minimum voltage along the transmission line, aiding in assessing standing wave patterns and calculating Standing Wave Ratio (SWR).
- Determining Input Impedance: It assists in finding the input impedance of circuits, providing crucial insights into circuit behavior and performance.
In summary, the Smith Chart serves as a versatile tool for RF engineers, offering precise solutions to impedance-related challenges and enhancing the efficiency of circuit design and analysis.
Understanding Reflection Coefficient Using the Smith Chart
In RF engineering, the reflection coefficient is a vital parameter that measures the ratio of reflected to incident voltage waves at a discontinuity in a transmission line, such as at a load or source impedance mismatch. The Smith Chart provides a graphical representation that simplifies the analysis of reflection coefficients. Reflection coefficient, often denoted by the symbol Γ (gamma), is a complex number that describes both the magnitude and phase of the reflected wave relative to the incident wave. It is defined as the ratio of the amplitude of the reflected voltage wave to the amplitude of the incident voltage wave. Mathematically, it can be expressed as:
Γ= Vreflected / Vincident
On the Smith Chart, the reflection coefficient is represented as a point along the circumference of the chart. The center of the chart corresponds to a reflection coefficient of 0 (indicating perfect impedance matching), while the outer edge corresponds to a reflection coefficient of 1 (indicating complete reflection).
The Smith Chart simplifies the determination of reflection coefficient values, enabling engineers to visually assess impedance matching and mismatching scenarios. By locating a point on the Smith Chart corresponding to the load impedance or normalized load impedance (usually denoted as Z or Z/Z₀), engineers can easily determine the reflection coefficient associated with that impedance. Moreover, the Smith Chart allows for the visualization of the effect of transmission line length and characteristic impedance on the reflection coefficient. As transmission lines introduce phase shifts to the incident wave, the position of the reflection coefficient point on the Smith Chart changes accordingly.
- Calculation of Reflection Coefficient from Load Impedance:
Given the load impedance ZL and the characteristic impedance of the transmission line Z₀, the reflection coefficient (Γ) can be calculated using the following formula:

This formula yields a complex value for Γ, representing both magnitude and phase information. The Smith Chart simplifies this calculation by providing a graphical method for finding Γ based on the given load impedance.
- Example Calculation:
Let’s consider a scenario where the load impedance ZL is 50 + j25 ohms and the characteristic impedance of the transmission line Z₀ is 50 ohms.

To simplify this complex fraction, we can multiply the numerator and denominator by the complex conjugate of the denominator:

So, in this example, the reflection coefficient Γ is approximately 0.235 – 0.00941j.
- Locating Reflection Coefficient on the Smith Chart:
Using the calculated value of Γ, we can locate this point on the Smith Chart. For example, on a normalized Smith Chart, the point would be approximately at coordinates (0.235, -0.00941). These calculations demonstrate how the Smith Chart simplifies the determination of reflection coefficient from load impedance and facilitates the analysis of impedance matching in RF systems.

Learn more about this topic by taking the complete course ‘Microwave Amplifier and Low Noise Amplifier (LNA) Design Theory and Principles online course – RAHRF526’. Watch the course videos for more detailed understanding. Also checkout other courses on RF system and IC design on https://rahsoft.com/courses/. Rahsoft also provides a certificate on Radio Frequency. All the courses offer step by step approach.


