Noise in Radio Frequency Systems
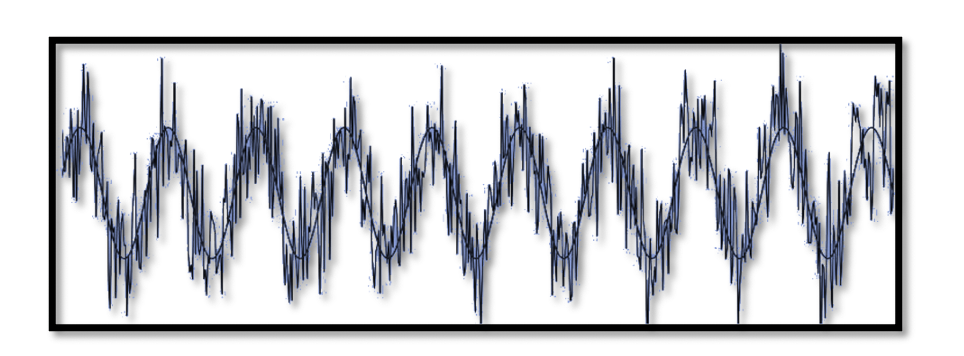
Noise in any RF system is signals with random amplitude and frequency. It can be shown as voltage or current, which is changing all the time. Depending on frequency distribution, it can extend in various forms across the frequency spectrum, although not always in the same amplitude. There is no specific pattern when it comes to noise.
There are different categories of noise defined as:
White noise: It affects all frequencies equally. The amplitude of the noise is constant for all frequencies. Amplitude is not changing with frequency.
Pink Noise: It doesn’t have a flat response. The power density decreases with increasing frequency.
Band Limited Noise: The noise is limited to a specific band; there is no noise out of the band. Noise can have its frequency band-limited either by filters or the circuit through which it passes.
Noise can mask out the desired signal causing data errors and increasing the bit error rate. We have an acceptable level of data error or signals to noise ration (SNR) against the cost involved in many instances.
If n(t) is the noise, then the average p[ower of the noise can be defined as:
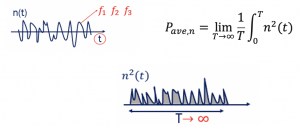
Observing the formula, we can see that the average power shows the area under the n2(t) signal, where T is going to infinity. The noise is delivered in the time domain, and it doesn’t the information about the noise power for different frequencies.
We want to see what kind of power we have in the frequency spectrum: the behavior of noise; for example, from 1GHz to 10 GHz, what is the power for each frequency. Hence, it is said that the frequency domain view gives more information and insights and is considered more useful in RF design. Therefore, we go through the power spectral density function (PSD).
What is Power Spectral Density (PSD) Function?
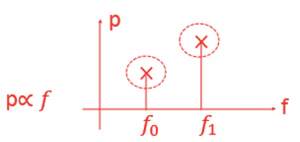
The Power Spectral Density (PSD) of a signal describes the power present in a signal as a function of per unit frequency. It shows the relationship between power and frequency. PSD also shows the variations in strength as a function of frequency. In other words, we can say that PSD shows the frequency variations at which they are strong or weak. For example, in the diagram, the noise power of f1 is higher than f0, which has low noise energy, so power is low.
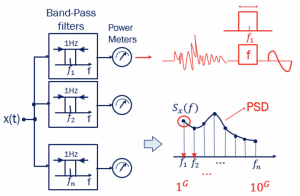
Theoretically, the PSD can be calculated. Assume we have a frequency spectrum from 1GHz to 10 GHz, as shown above, and divide the spectrum into many different frequencies. Now define the bandpass filter for each frequency within the spectrum, keeping the particular frequency as the center frequency in the bandwidth of 1Hz.
The filter attenuates all other frequencies and allows only the center frequency, for example, f1. Consider the signal is a kind of noise that passes through the bandpass filter, then we can get a cosine wave as output, and the power can be calculated of that particular output wave. The power meter can be used to calculate. This process can be repeated for other frequencies from f1 to fn with 1Hz bandwidth. Plotting these values, we get the PSD. This shows the power of noise with different frequencies.
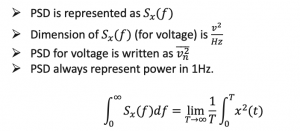
Few points to remember for PSD are listed above. PSD is always representing power in 1Hz, therefore the bandwidth was limited to 1Hz. If we take the integral of PSD, we can see that it is Paverage as shown in the earlier and the area under PSD equals average power.


