P1dB: A Critical Parameter in Amplifier Performance
P1dB: Insights and Implications
Understanding P1dB, or the 1dB compression point, is crucial for engineers and designers working with RF (Radio Frequency) and microwave amplifiers, as it provides a clear indication of an amplifier’s linearity and dynamic range. This metric is not just a number but a gateway to comprehending the nonlinear behavior of amplifiers under varying power levels. Here, we delve deeper into the nuances of P1dB, exploring its implications, measurement nuances, and significance in real-world applications.
Theoretical Background and Practical Implications
The concept of P1dB originates from the need to quantify an amplifier’s linearity. In an ideal scenario, an amplifier would maintain a constant gain across its operating range, meaning the output power would increase linearly with every increment in input power. However, physical limitations and the inherent characteristics of electronic components introduce nonlinearity, especially as the input signal approaches the amplifier’s maximum capacity. The P1dB point serves as a critical benchmark, beyond which the amplifier can no longer be considered linear.
Measurement Nuances and Challenges
While the basic methodology for measuring P1dB might seem straightforward, several challenges can arise in practice. These include:
- Device Variation: Different amplifiers, even of the same model, can exhibit slight variations in their P1dB points due to manufacturing tolerances. This variability necessitates precise and individualized measurements for critical applications.
- Thermal Effects: The operating temperature can significantly impact an amplifier’s performance. As components heat up, their electrical properties may change, potentially altering the P1dB point. Consistent temperature control or compensation is crucial for accurate measurements.
- Frequency Dependence: P1dB can vary across the amplifier’s frequency range. This characteristic requires that measurements be taken at multiple frequencies to fully understand an amplifier’s performance spectrum.
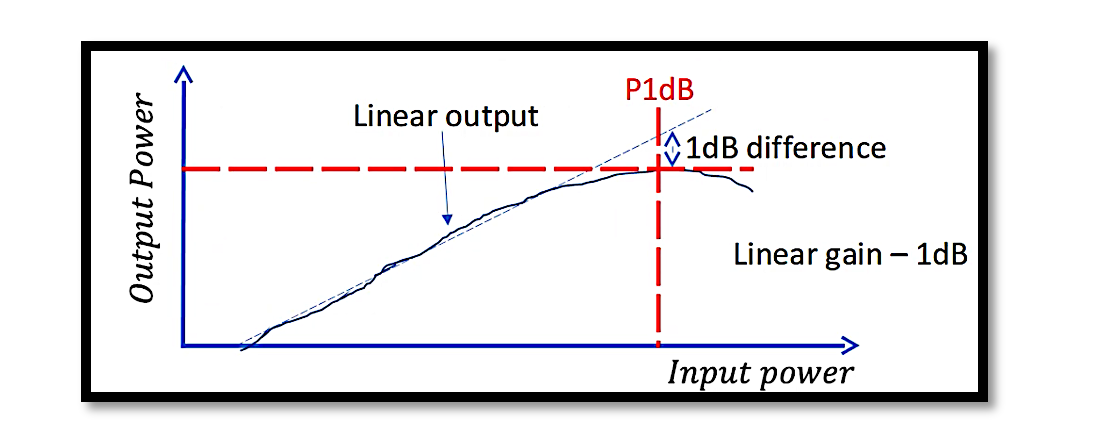
P1dB is a fundamental measurement widely discussed within the realm of power amplifiers, serving as a pivotal indicator of an amplifier’s performance under nonlinear conditions. Expressed in dBm, P1dB specifies the output or input power at which the amplifier reaches its 1dB compression point. This point marks a significant deviation from the amplifier’s linear operation, where the actual gain begins to diverge from the theoretical linear gain. Initially, amplifiers operate in a linear fashion, providing a consistent gain as the input power increases. However, beyond a certain threshold, this gain no longer scales linearly with input power, leading to a saturation effect.

The 1dB compression point is essentially the juncture at which the difference between the amplifier’s actual gain and its expected linear gain is exactly 1dB. This phenomenon is a clear indicator of the onset of nonlinear behavior, signifying that the amplifier can no longer maintain its linear amplification efficiency due to saturation. The significance of the P1dB metric lies in its ability to quantify this shift, offering a precise measurement of when and how the amplifier’s performance begins to compress. This makes P1dB an invaluable parameter for assessing the nonlinear characteristics of devices such as power amplifiers, providing insights into their operational limits and behavior under varying power levels.
Plotting the P1dB Measurement: Techniques and Considerations


To accurately assess the P1dB compression point, there are two primary methods for plotting the measurement, focusing on the relationship between output power and input power, both quantified in dBm. Initiating this process requires starting from a well-defined linear region. From this baseline, input power is incrementally increased, preferably in 1dB steps, to methodically observe the amplifier’s response. It’s critical to ensure that both input and output power measurements are correctly referenced to the ports of your Device Under Test (DUT), typically a power amplifier in this context.
The DUT exhibits a characteristic linear gain during the initial phase, illustrated by a straight line on the plot where the ratio of output power increase to input power is directly proportional, maintaining a 1:1 relationship. This proportionality implies that for every 1dB increase in input power, there should be a corresponding 1dB increase in output power, reflecting the amplifier’s linear operational phase.
However, as input power continues to rise, a notable deviation from this linear behavior emerges. The amplifier begins to saturate, and the gain incrementally decreases, diverging from the initial linear relationship. A critical observation point is when the measured gain falls 1dB short of the theoretical (linear) gain. This specific juncture is defined as the P1dB compression point. At P1dB, the amplifier’s output power, expressed in dBm, effectively indicates the threshold where linear gain diminishes by 1dB, marking a pivotal transition to nonlinear operation. This plotting technique not only identifies the onset of gain compression but also provides a quantifiable measure of the amplifier’s linear-to-nonlinear transition, offering invaluable insights for optimizing amplifier performance and understanding its limitations under increased power loads.
Implementing P1dB Measurement: Setup and Methodology
When determining the P1dB compression point for a component, if the output power at P1dB is recorded as 30dBm, this value directly indicates the amplifier’s output power level at which gain compression is significant. Beyond presenting data in terms of output versus input power, an alternative plotting method involves charting the gain (in dB) against the input power. In this approach, the gain curve should initially display a constant value, illustrating the amplifier’s linear performance phase. The curve will eventually depict a decline, mirroring the behavior observed in the output/input power plot. The pivotal moment when the gain decreases by 1dB from its expected constant value signifies the P1dB point, offering a different perspective on identifying the amplifier’s compression characteristics.
The practical setup for measuring P1dB involves a relatively straightforward arrangement comprising an RF source, the Device Under Test (DUT), and a spectrum analyzer or power sensor. The crucial steps include a meticulous calibration of the entire setup and accurate determination of the input and output power levels related to the DUT. This foundational preparation ensures the reliability of the measurements to be taken.
To execute the measurement, one should methodically increase the input power from the RF source, typically in 1dB increments. This granularity is sufficient to observe the nuanced changes in gain behavior, avoiding any abrupt transitions that might mask the gradual onset of compression. It’s important to note that the decline towards the 1dB compression point does not occur abruptly but rather as a steady roll-off. This gradual decrease in gain underscores the necessity of precise control and monitoring of input power levels, allowing for the accurate identification of the P1dB point. Through this meticulous process, engineers can effectively measure and understand the nonlinear performance characteristics of amplifiers, facilitating the optimization of RF systems for both linear and nonlinear operation domains.

Learn more about this topic by taking the complete course ‘Introduction to RF Testing Fundamentals and RF Test Architecture – RAHRF412’. Watch the course videos for more detailed understanding. Also checkout other courses on RF system and IC design on https://rahsoft.com/courses/. Rahsoft also provides a certificate on Radio Frequency. All the courses offer step by step approach.
Tag:Linear Gain, P1dB, P1dB measurement


