Relationship Between Transmission Lines and the Smith Chart
What are Transmission Lines and its relationship with Smith Chart?
Transmission lines are a fundamental part of electrical engineering used to transmit electrical signals or power from one point to another efficiently. They’re composed of conductors and insulators and are used for various applications like telecommunications, power distribution, and RF (Radio Frequency) engineering.
A transmission line has a characteristic impedance that determines how signals propagate along its length. When the impedance of the transmission line matches the impedance of the source and load connected to it, maximum power transfer occurs, minimizing signal reflections.
The Smith chart is a graphical tool used in RF and microwave engineering to analyze and design transmission lines and matching networks. It provides a visual representation of complex impedances along the length of a transmission line. The chart displays normalized impedance and admittance values, allowing engineers to easily determine impedance matching, reflection coefficients, and other parameters at different points along the transmission line. The relationship between transmission lines and the Smith chart lies in their combined use for impedance matching and analyzing the behavior of RF circuits. Engineers use the Smith chart to perform calculations and design transmission lines that match impedance between devices, ensuring efficient power transfer and minimizing signal loss due to reflections.
Impedance Transformations: Transmission lines exhibit impedance transformations due to their length, termination, and characteristic impedance. The Smith Chart serves as a visual aid, illustrating how impedance changes along the length of the line. Engineers leverage the chart to predict impedance variations and plan for efficient signal transfer.
Visualizing Line Characteristics:
Reflections and Standing Waves: Transmission lines can experience reflections and standing waves due to impedance mismatches or changes along their length. The Smith Chart vividly displays these phenomena, allowing engineers to pinpoint locations of impedance mismatches and make necessary adjustments for optimal signal transfer.
Losses and Attenuation: Line characteristics like losses and attenuation are critical in signal integrity. The Smith Chart aids in comprehending these factors, showcasing how impedance variations relate to signal loss and attenuation along the transmission line.
Impedance Matching Strategies:
Transmission lines often require precise impedance matching for maximum power transfer and minimal signal loss. The Smith Chart serves as a guide, enabling engineers to design matching networks and adjust line impedances for optimal performance.

FAQs:
Q: How does the Smith Chart assist in predicting impedance variations in transmission lines?
A: The Smith Chart visualizes impedance transformations along the length of the line, allowing engineers to foresee changes in impedance due to reflections, standing waves, or mismatches.
Q: What role does impedance matching play in transmission line design?
A: Impedance matching ensures maximum power transfer and minimal signal loss in transmission lines. The Smith Chart facilitates designing matching networks for efficient signal transmission.
Example Scenario: Transmission Line Analysis using the Smith Chart
Consider a transmission line with the following specifications:
- Characteristic Impedance (Z0) = 50 ohms
- Length (L) = 0.4λ (where λ is the wavelength)
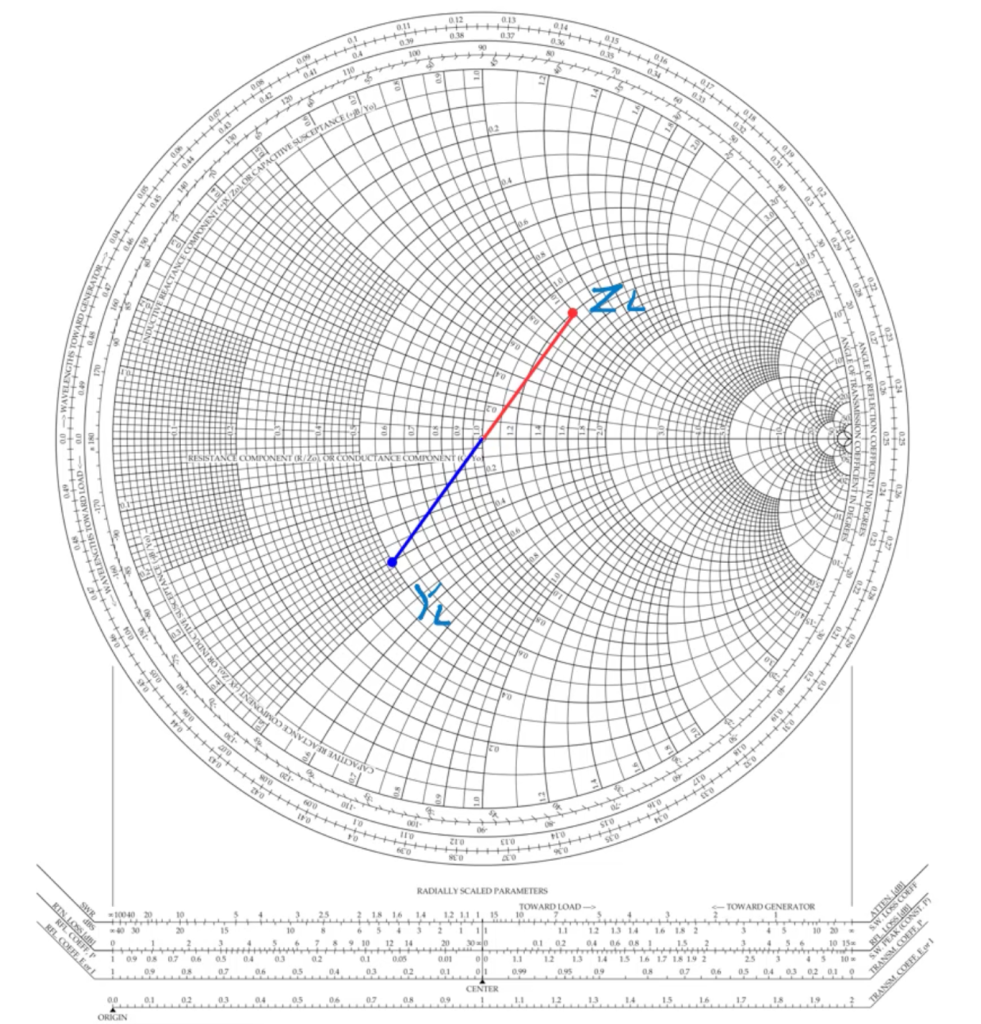
- Load Impedance (ZL) = 60 + 50j ohms
- Calculating Normalized Load Impedance (Z1):
Start by normalizing the load impedance:

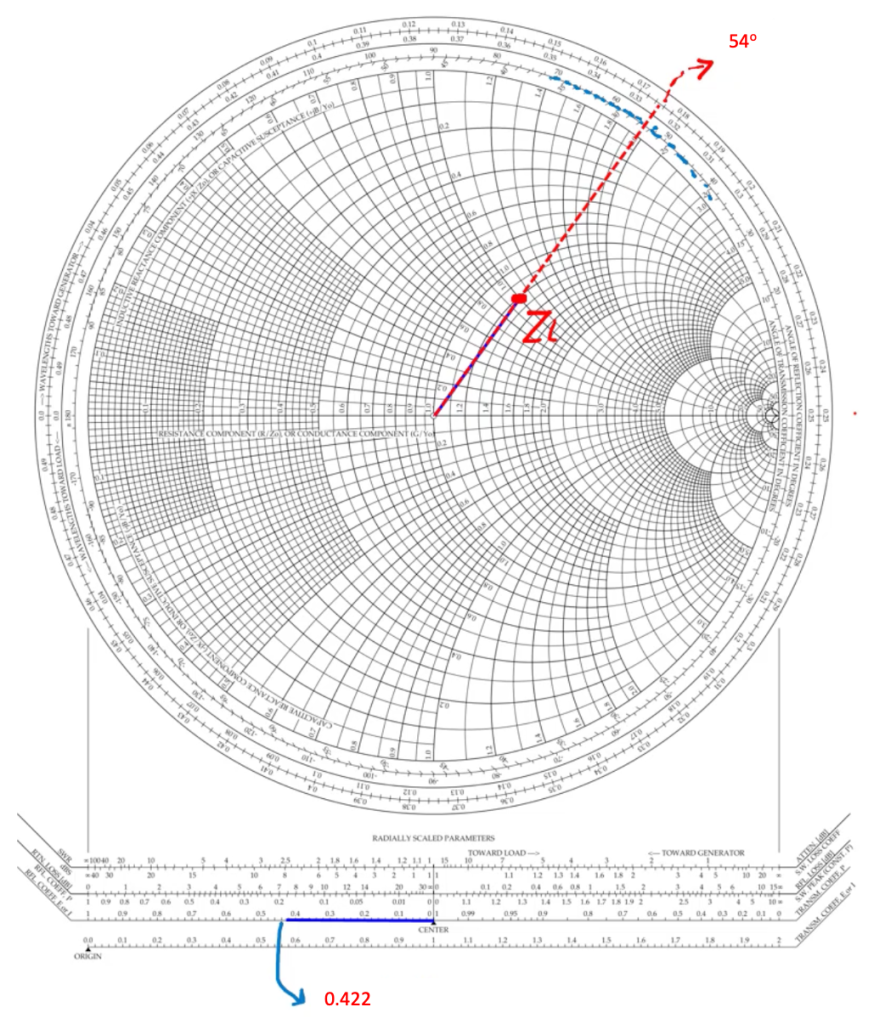
Plot the normalized load impedance (1.2 + j1) on the Smith Chart to visualize its position.
- Determining Reflection Coefficient (Γ):
Calculate the reflection coefficient using the Smith Chart: Locate and mark this reflection coefficient value on the Smith Chart. This representation showcases the amplitude and phase of the reflected signal, aiding in understanding impedance mismatches. Additionally, the reflection coefficient (Γ) can be calculated using:


3. Finding Load Admittance (YL):
Compute th e load admittance based on the load impedance:

Locate this load admittance value on the Smith Chart to visualize its position relative to the impedance plane, providing insights into how the load interacts with the transmission line. Similarly, the load admittance (YL) can be calculated by taking the reciprocal of the load impedance.
The Smith Chart serves as a beacon in unraveling the complexities of transmission lines. Its visual representation of impedance transformations, insights into line characteristics, and guidance in impedance matching make it an indispensable tool for engineers navigating the intricacies of RF transmission line analysis. This comprehensive exploration showcases how the Smith Chart acts as a guiding compass in understanding transmission lines, aiding engineers in optimizing signal transfer, minimizing losses, and designing efficient RF circuits.

Learn more about this topic by taking the complete course ‘RF Microwave and Radio Frequency Transmission Theory Online Course – RAHRF200’. Watch the course videos for more detailed understanding. Also checkout other courses on RF system and IC design on https://rahsoft.com/courses/. Rahsoft also provides a certificate on Radio Frequency. All the courses offer step by step approach.

