Noise Figure: Definitions, Significance, and Calculations
Introduction:
Noise Figure (NF) is a fundamental metric that measures the degradation of the signal-to-noise ratio (SNR) as it traverses through a device or system. It serves as a vital parameter in evaluating the noise performance of various electronic components, especially in scenarios where preserving signal integrity is paramount.
In passive devices, where the emphasis is on signal transfer without amplification, the Noise Figure is inherently tied to their loss or attenuation. The NF in passive components reflects the impact of the device on the signal-to-noise ratio, providing insights into the overall signal quality.
The measurement of Noise Figure is particularly prevalent in devices such as Low Noise Amplifiers (LNAs), Mixers, and receivers. These components, critical in signal processing and communication systems, demand careful consideration of their noise characteristics. Minimizing the Noise Figure in these devices is essential for ensuring optimal system sensitivity and signal quality.
What is Noise Figure?
Noise figure is a parameter that quantifies the degradation of the signal-to-noise ratio (SNR) as it passes through a device or system. It is a measure of how much noise a device or system adds to the signal it processes, relative to an ideal device that adds no noise. NF is expressed in decibels (dB) and is a critical specification for amplifiers, receivers, and other signal-processing devices, indicating their noise performance.
Definition
Formally, noise figure is defined as the ratio of the input signal-to-noise ratio to the output signal-to-noise ratio of a device. It provides a comparative measure of the device’s noise performance against an ideal, noiseless standard. A lower NF indicates better performance, as it means the device adds less noise to the signal.
Basic Formula
The basic formula for calculating the noise figure in linear terms is:

Friis Formula for Cascaded Stages
In systems with multiple cascaded components, such as multiple amplifiers in a row, the Friis formula is used to calculate the overall noise figure of the system. The Friis formula is given by:

This formula highlights the importance of the first stage’s noise figure and gain in determining the overall system performance.

The measurement of Noise Figure is particularly prevalent in devices such as Low Noise Amplifiers (LNAs), Mixers, and receivers. These components, critical in signal processing and communication systems, demand careful consideration of their noise characteristics. Minimizing the Noise Figure in these devices is essential for ensuring optimal system sensitivity and signal quality.
One of the key tools for assessing the overall noise performance of a system is Friis’ Noise Formula. This formula enables the calculation of the total Noise Figure of a system composed of multiple cascaded stages. In this context, it becomes evident that each stage contributes to the overall noise characteristics of the system. The formula accounts for the Noise Figure of individual components and their gains, emphasizing the importance of the initial stages in determining the system’s noise performance.
In summary, Noise Figure stands as a crucial metric in the realm of signal processing, telecommunications, and electronics. Understanding its implications, especially in the context of LNAs, Mixers, and receivers, allows engineers to make informed decisions in the design and optimization of systems. By applying tools like Friis’ Noise Formula, professionals can strategically manage and minimize the impact of noise, ultimately enhancing the sensitivity and performance of electronic systems.
Noise Figure Measurement: Insights into the Process

In the pursuit of optimal noise performance, engineers and technicians employ Noise Figure (NF) meters to measure and evaluate the impact of a device or system on the signal-to-noise ratio. The measurement process involves the use of a Noise Source, and the approach is critical for accurate and reliable results.
Utilizing a Calibrated Noise Source
The foundation of Noise Figure measurement lies in the implementation of a Noise Source with calibrated Excess Noise Ratio (ENR) values. ENR represents the difference between the noise generated at 290 degrees Kelvin and a higher temperature, as defined by the noise source. This calibrated source serves as a reference point, allowing for a precise assessment of the device or system under test.
Understanding Excess Noise Ratio (ENR)
ENR, expressed in decibels, provides a quantifiable measure of the excess noise introduced by the source. It is specified across a frequency range and encapsulates the additional noise generated beyond what would be present at a standard temperature of 290 degrees Kelvin. This calibration ensures that the measurement process is anchored in known values, enhancing the accuracy of the Noise Figure assessment.
Calibration and Input Requirements
For the Noise Figure meter to provide accurate measurements, it must be calibrated with the specific noise source used. This calibration process often involves inputting an ENR vs frequency table into the meter. The calibration aligns the meter with the characteristics of the noise source, facilitating a tailored and precise measurement.
Embracing Linearity in Noise Measurement
A fundamental consideration in Noise Figure measurement is the acknowledgment of the linear nature of noise. Unlike other signals that may exhibit nonlinear behaviors, noise follows a linear path. This aspect is crucial in the accurate determination of the Noise Figure, ensuring that the measured values faithfully represent the impact of the device or system on the signal-to-noise ratio.
In conclusion, the Noise Figure measurement process, particularly with the use of a Noise Figure meter and a calibrated Noise Source, is a meticulous and calibrated approach. The reliance on ENR values, the necessity of meter calibration, and the recognition of noise linearity collectively contribute to a comprehensive and accurate assessment of the noise characteristics in electronic components and systems. This methodological approach empowers engineers to make informed decisions in optimizing signal quality and minimizing noise in their designs.
Noise Figure Measurement: A Step-by-Step Approach with a Noise Figure Meter

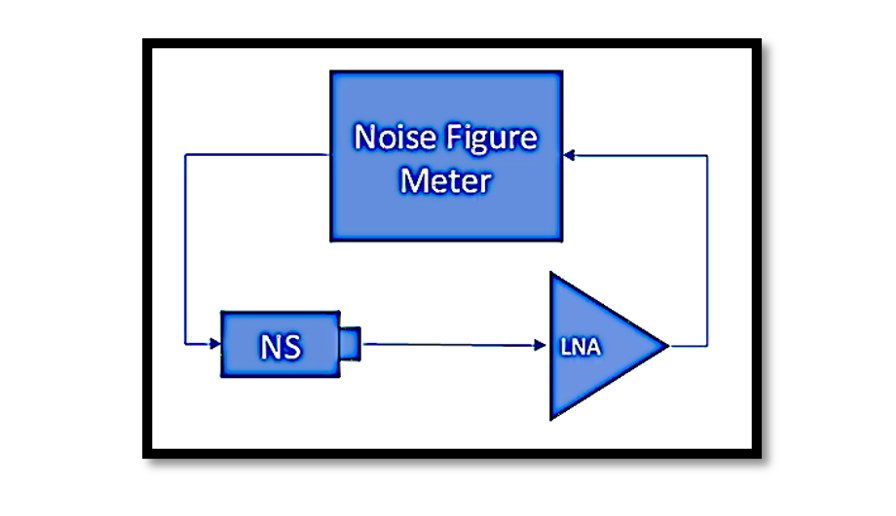
Accurately measuring the Noise Figure (NF) of a device, particularly critical components like Low Noise Amplifiers (LNAs), is essential for evaluating and optimizing signal performance. The process involves employing a Noise Figure Meter (NFM) in conjunction with a calibrated Noise Source (NS) to ensure precision in the measurements. Here is a step-by-step approach to conducting a Noise Figure measurement:
1. Calibration of the Noise Figure Meter (NFM):
Before initiating the measurement, it is crucial to calibrate the NFM using the Noise Source. This step ensures that the meter is aligned with the characteristics of the noise source. The calibration process involves establishing a reference point for the NFM by accounting for any inherent noise introduced by the measurement system itself. This calibration step typically includes setup components and, if necessary, a pre-amplifier.
2. Connect the Noise Source (NS) to the Input of the LNA:
Once the NFM is calibrated, connect the calibrated Noise Source to the input of the device under test, in this case, the Low Noise Amplifier (LNA). The Noise Source serves as a standardized reference, producing known noise levels across a specified frequency range. This step ensures that the NFM can accurately measure the noise characteristics introduced by the LNA.
3. Connect the Output of the LNA to the NFM Input:
With the Noise Source connected to the input of the LNA, route the output of the LNA to the input of the Noise Figure Meter. This configuration allows the NFM to capture and analyze the signal as it exits the LNA, taking into account any noise introduced by the amplification process.
4. Measure the Noise Figure:
Once the setup is complete, initiate the measurement process on the Noise Figure Meter. The meter will calculate the Noise Figure based on the calibrated reference from the Noise Source and the signal characteristics obtained from the LNA. The resulting measurement provides valuable insights into the noise performance of the LNA, aiding engineers in optimizing the overall system for enhanced sensitivity and signal quality.
This approach ensures that the Noise Figure is measured with precision, considering the linearity of noise and accounting for any variations across the frequency spectrum. By systematically following these steps, engineers can obtain reliable Noise Figure measurements critical for the design and performance evaluation of electronic systems.

Learn more about this topic by taking the complete course ‘Introduction to RF Testing Fundamentals and RF Test Architecture – RAHRF412’. Watch the course videos for more detailed understanding. Also checkout other courses on RF system and IC design on https://rahsoft.com/courses/. Rahsoft also provides a certificate on Radio Frequency. All the courses offer step by step approach.

