Understanding Load Pull for Power Amplifiers
In the field of RF (Radio Frequency) engineering, load pull is a critical technique used to optimize the performance of power amplifiers. By varying the load impedance presented to a device under test (DUT) and monitoring specific performance parameters, engineers can achieve the desired balance between power, efficiency, and linearity. This blog will delve into the principles of load pull, its application in power amplifier design, and the interpretation of load pull data on Smith charts.
What is Load Pull?
Load pull involves systematically varying the load impedance seen by the power amplifier and measuring the resulting changes in performance metrics such as output power, gain, and efficiency. This method helps in identifying the optimal load conditions that maximize performance according to specific criteria.
The basic setup for a load pull measurement includes:
- A signal source to drive the power amplifier.
- A tunable load impedance network connected to the output of the amplifier.
- Measurement equipment to capture output power, gain, and efficiency.
Key Parameters in Load Pull
- Output Power (Pout): The power delivered by the amplifier to the load.
- Gain (G): The ratio of output power to input power.
- Efficiency (η): The ratio of RF output power to DC input power.
These parameters are functions of the load impedance, ZL, which can be represented as ZL=R+jX, where R is the real part and X is the imaginary part.
Load Pull Measurements
Load pull measurements involve the following steps:
- Setup Configuration: Connect the power amplifier to a load tuner capable of varying ZL.
- Impedance Sweeping: Systematically change ZL across a range of values.
- Data Collection: Measure output power, gain, and efficiency for each impedance point.
- Data Plotting: Plot the collected data on a Smith chart to visualize the performance contours.
Interpreting Load Pull Data on Smith Charts
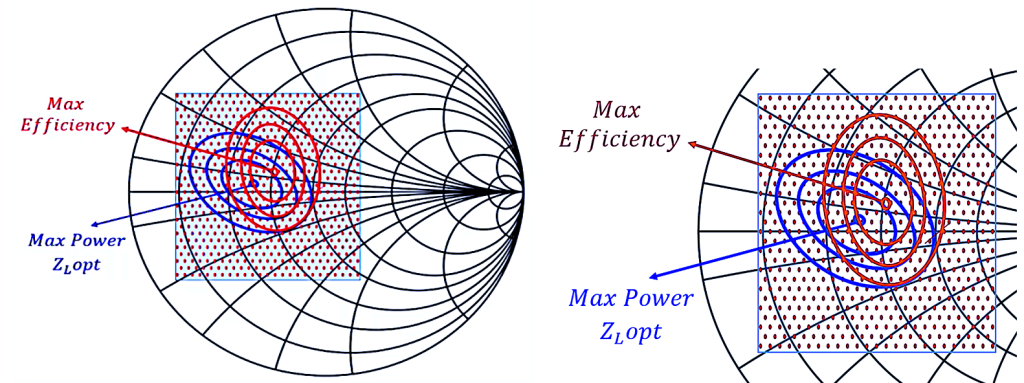
A Smith chart is a polar plot used to represent complex impedance. The load pull data is overlaid on the Smith chart, showing contours of constant performance metrics. The key areas to focus on include:
Max Power Contour: Indicates the impedance points where the amplifier delivers maximum output power.
Max Efficiency Contour: Shows the impedance points where the amplifier operates with maximum efficiency.
Example Analysis
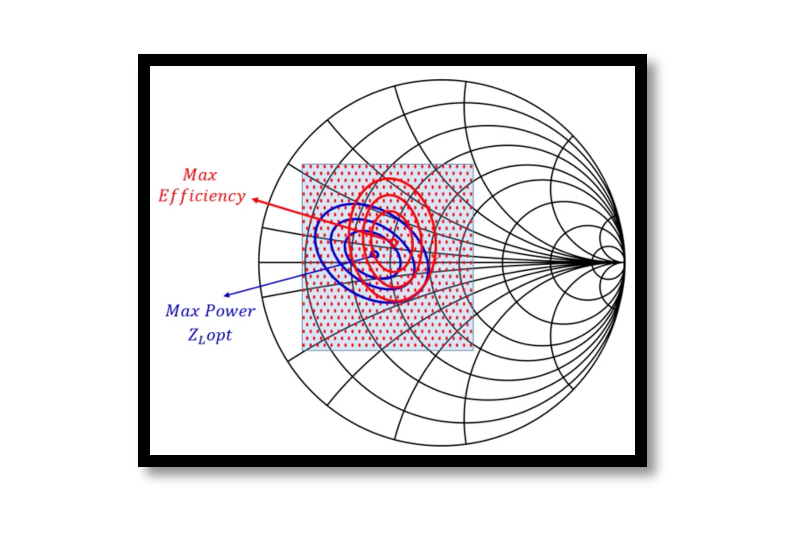
Consider the Smith chart from the images provided. The chart displays two primary contours:
Max Efficiency (red contour): These contours highlight the regions where the amplifier efficiency is maximized. Engineers aim to adjust the load impedance to align with these regions to enhance efficiency.
Max Power Zopt (blue contour): This contour represents the optimal load impedance for achieving maximum output power. It is crucial to balance this with efficiency to
The red and blue dots within the Smith chart signify the specific impedance points tested during the load pull measurement. The overlapping areas of the red and blue contours represent the ideal trade-off points where both power and efficiency are optimized.
Practical Applications
Load pull techniques are extensively used in the design and optimization of power amplifiers for various applications, including:
Wireless Communication Systems: Ensuring efficient and powerful signal transmission.
Radar Systems: Optimizing amplifiers for high-power signal generation.
Satellite Communications: Balancing power and efficiency to maintain signal integrity over long distances.
Take our entry level course (Below) for free using coupon code RAHRF101BLOG
RF Fundamentals, Basic Concepts and Components – RAHRF101
For limited time take an additional 10% off of all our courses using coupon code RFCERT10
Rahsoft RF Certificate and courses
Conclusion
Load pull is an indispensable technique in RF engineering for power amplifier optimization. By comprehensively understanding and applying load pull data, engineers can design amplifiers that meet stringent performance criteria, ultimately enhancing the reliability and efficiency of RF systems. The use of Smith charts in visualizing and interpreting load pull results provides a clear and intuitive method for identifying optimal impedance conditions, making load pull a vital process in the advancement of RF technology.

Learn more about this topic by taking the complete course ‘Linear RF Power Amplifier (PA) Design Theory and Principles online course – RAHRF562’. Watch the course videos for more detailed understanding. Also checkout other courses on RF system and IC design on https://rahsoft.com/courses/. Rahsoft also provides a certificate on Radio Frequency. All the courses offer step by step approach.
Tag:Load pull, POwer Amplifier

